
1. How to complete an EViews Assignment: An Easy Student Guide
Students will need to use econometrics and statistics skills together in EViews assignments. Students are not only required to choose commands but also expected to explain their model, analyse data, draw conclusions and identify links between evidence and the research question. EViews can be used to manage data, do econometric analysis, make forecasts, and create tables or graphs, but it cannot decide the suitability of the model (Zaki Guirguis, 2023). A guide unlike any other to systematic EViews assignment steps: understanding the questions, preparing datasets, interpreting the results, and presenting an evidence-based report.
2. What is an EViews Assignment
An EViews assignment asks students to use econometric tools and methods on real economic data to solve a specific research question. It assists economics and econometrics students to explore relationships and appraise evidence from regression or time-series analysis, hypothesis testing, descriptive statistics, correlation or forecasting (Ronderos Pulido, 2025). Students use EViews to prepare to interpret and estimate data; appropriate methods must be used and results discussed. A useful guide to EViews assignments will then involve mapping the analysis to the question and requirement of the data set and the need for assessment.
Also, when students are dealing with finance-related topics, they can also check out Finance Assignment Help in case they have any analytical or quantitative assignment in need.
3. How to complete an EViews Assignment
1. Understanding of assignment’s question
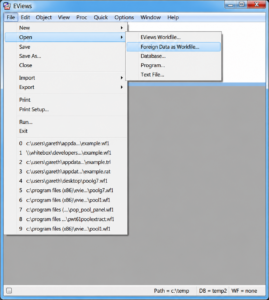
Read a brief on the assignment before using EViews and determine the research question, dependent and independent variables, required model, hypothesis test, dataset, and econometric technique. For example, regression can analyse the relationship between variables, and time series can analyse the observations between the time periods.
2. Preparation of Dataset
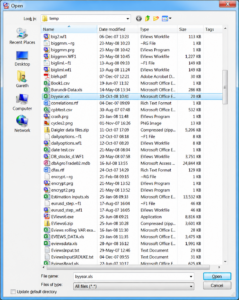
Data is fundamental to EViews analysis, and much better analyses can be done if the data is well structured. While preparing the dataset, students can also consult EViews’ official guide for importing data. Describe the source of the data, the meaning of variables, their units, duration and frequency and use simple and standard naming conventions for variables (Mati et al. 2023). Recognise missing data, duplicate observations and data entry mistakes and ensure there are an appropriate number of observations and frequencies are consistent. Use well organised labels on columns organised as dates, and correctly formatted numbers in Excel or CSV files. Such preparation minimises the estimation problems and aids the econometric analysis and interpretation of results.
3. Creation of work file and import data
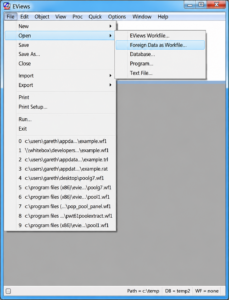
After checking the dataset, create an appropriate work file in EViews and select the correct structure, such as annual, quarterly or monthly observations. The official EViews workfile guide explains how to set up a workfile and organize data for analysis. Import the prepared dataset (Excel or CSV); check variables, dates, observations and frequency against the original file. Ensure that series of numbers are identified accurately and that no numbers are missed. This verification prevents that a work file that is not properly structured in EViews will throw off results of data analyses in subsequent futures.
4. Investigate and interpret data
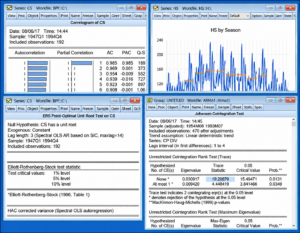
Examine the data with descriptive statistics such as the mean, standard deviation, minimum and maximum values before choosing an econometric model. Graphs can then show trends, unusual observations and any obvious relationships between the variables. This is an initial look which enables students to come to an understanding of the size and nature of the data before trying to take it “for granted” as a set of numbers that has nothing to say. EViews yields specific functionality to help when analysing and generating graphs of the data.
5. Choose and run the required econometric model
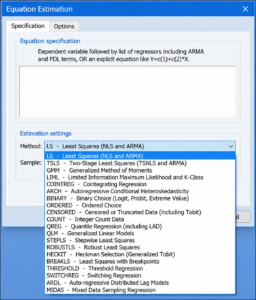
The purpose in model selection is to answer the research question and to match the model to the data, rather than to a set of pre-determined EViews procedures. Depending on the assignment, students may use OLS regression, time-series analysis, unit-root/ADF testing, correlation or another appropriate test (Stratan and Gutium, 2022). The arguments should be given for the selection of variables in a regression equation, and how the model was specified should be justified prior to estimating the model in EViews.
A more comprehensive description of using EViews for econometric analysis can be found in our guide on How to Use EViews for Econometric Analysis.
6. Review EViews output
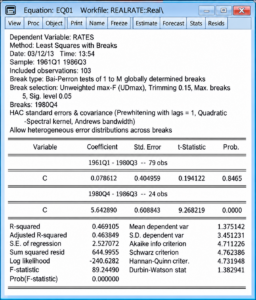
Once estimated, check the results in EViews and do not photocopy the table into the assignment. Key elements may include coefficients, standard errors, t-statistics, probability/p-values, R-squared, adjusted R-squared and the F-statistic. Each offers different information regarding the estimated model and should be taken into account prior to making conclusions. In addition, EViews offers post-estimation and testing tools, which may aid in additional model checking and testing.
7. Interpretation of the results
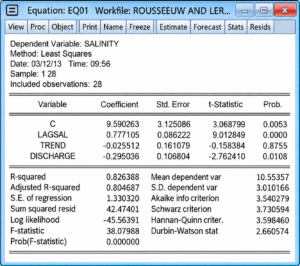
The second step is to interpret the results and let people know what the results mean. The positive or negative coefficient indicates the estimated direction of the relationship and the p-value is used to talk about the level of statistical significance of the test chosen, within the hypothesis framework. R-squared will measure the fraction of variation that can be explained by the fitted model, but can never be interpreted as a fact that the model is a suitable model. The results obtained must be then linked to the initial research question, not just presented as a statistics.
8. Write the EViews assignment report
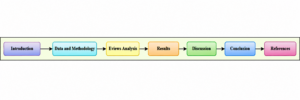
Lastly, structure the results in an assignment report to EViews (Faridah and Aisyah, 2023). The appropriate order is Introduction, Data/Methodology, EViews Analysis, Results, Discussion, Conclusion, and References. Only include tables and figures that illustrate the explanation; then, interpretation of the important findings. The report should show how this is criterion method addresses the research question instead of merely copying and pasting output from EViews.
4. Common pitfalls in an EViews assignment
There are several potential issues that can reduce the validity of a technically accurate analysis. A superficial reading of the question may give an inappropriate model or irrelevant variables. If observing is incomplete, this can lessen the reliability of the data set, and if the data frequency is misrepresented this can lead to difficulties in analysing a time-series (Ronderos Pulido, 2025). The other common pitfall is using an advanced econometric test without justification as to why it is sensible. Another problem with copying EViews tables is that students lose analytical value when they do not interpret the Coefficients, Probability or the Model statistics. Lastly, references and guidelines from the university should not be deemed as merely administrative information.
5. How to complete an EViews assignment successfully
Read the assignment brief to ensure the required methods, formatting and submission standards are fulfilled. Use consistent variable names, formats and observation times throughout data analysis. Provide some interpretation of each major result instead of providing EViews output without an explanation. Carefully use tables and figures with relevant outputs that directly answer the research question. Lastly, proofread for calculation errors, confusion in explanation, references missing, formatting difficulty and inconsistencies before the final submission.
6. When can students seek EViews assignment help
EViews assignment help can be sought by students if the assignment requires them to perform unfamiliar econometric procedures, complex regression analysis, time-series data, forecast or interpret response very difficult. This might be helpful when a user doesn’t know why a specific model or diagnostic test is needed but should use it (Mi, 2023). A student can effectively estimate a regression and have only a limited understanding of the meaning of a coefficient, or the meaning of a result from ADF, or model diagnostics. In such cases, the teaching should be directed to comprehending the analysis and reporting results clearly.
7. Providing answers to regularly asked EViews assignments
- How do I start an EViews assignment?
First, determine the research question, variables, dataset, tests and university directions. Make and check the data before choosing the model.
- What analysis can be conducted in EViews?
EViews enables statistical and econometric analysis, such as regression analysis, time-series analysis, time-series forecasting, testing of hypothesis, and several advanced regression techniques.
- How do I interpret EViews regression results?
Discuss coefficient, standard error, t-statistic, probability value and then model-level statistics and diagnostics. Lastly, summarize the evidence provided back to the research question.
- Can EViews be used for time-series assignments?
EViews is developed to work with time series data and includes the lag, différences, seasonality, serial correlation, ARIMA and forecasting procedures.
- What would be appropriate for EViews results in an assignment?
Choose appropriate output and present it clearly, explaining results in words. Don’t fill the report with screen shots or otherwise uninterpreted statistical tables.
8. Conclusion
A successful EViews assignment involves a series of related decisions: read the brief, set up reliable data, design the right file, browse the data, decide on a defensible economic model, examine the results and summarize the conclusions with respect to the research question. EViews contains the tools, but it is important that the tools be applied appropriately for quality assignments. EViews students can turn to EViews Assignment Help to supplement their analysis, regression and time-series studies, as well as to interpret the results. Students are also able to use Western Assignment Help service for help with various assignments and subjects.
EViews Assignment Help for Students
Students can approach EViews Assignment Help when they are not able to solve EViews data analysis, regression and making sense of the outcome of time-series analysis. Support can be helpful during the understanding of how to carry out an EViews assignment, preparation of datasets, choice of suitable econometric models and interpretation of output like coefficient, p value, R square etc. Regreucessing, EViews time series analysis, hypothesis testing, forecasting or diagnostic tests) is important in an EViews econometrics assignment.
Some model reports how to structure the report for an EViews assignment, explain rather than simply copy and paste tables relevant to the assignment. The students themselves should use the support to reinforce the steps of the EViews assignment, but make sure that the student’s analysis is connected to the research question, properly referenced and comply with university requirements.